May
2013 AD
THEORY: If the Jewish occupation of your State exceeds 2%, as they are in 10 States, you are all but guaranteed to live in a Blue State.
THEORY: If your Jewish occupation of your State is less than 0.5%, as happens in 19 States, you are all but guaranteed to live in a Red State
As the Jewish population increases, so does the likelihood of you living in a Blue State.
In reverse, as the Jewish population decreases, so are you more likely to live in a Red State.
If you love freedom,
pick a State to live in
which does not have
a large number of Jews.
Freedom in Red
vs
Repression in Blue
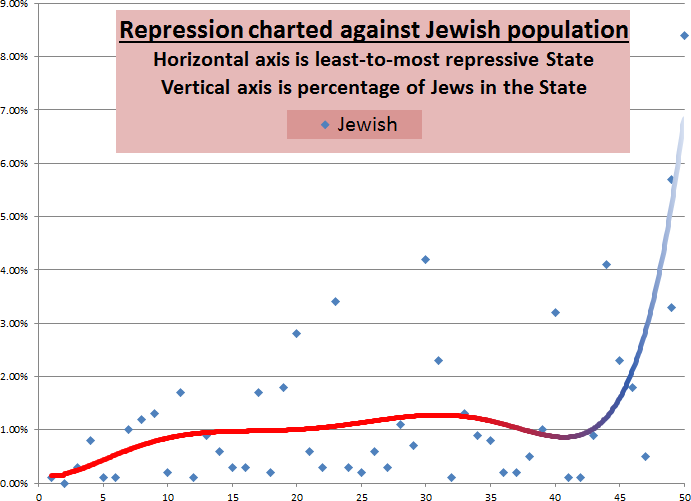
From the chart above, (taken from: the George Mason University Mercatus Center study, And the least free state in America, is…), we can see a correlation between the percentage of Jews in a State versus the chances it will be a highly regulated and repressive State. Michael Bloomberg comes to mind as one reason why New York is the most repressive State in the United States.
Of course, the graph is heavily influenced by the percentage of other minorities as well; hence the reason it is weighted down by States like Louisiana and Mississippi.
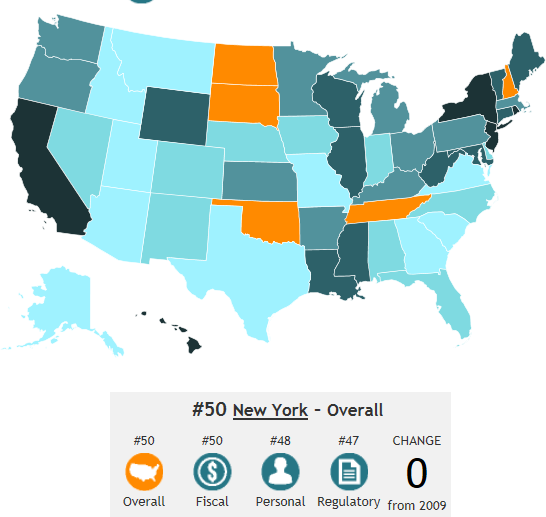
The screenshot below of the George Mason University Mercatus Center study is below
SOURCE: The Jewish Virtual Library
And the least free state in America, is… by George Mason University Mercatus Center
Article located at:
http://www.thechristiansolution.com/doc2013/580_IowaPropaganda.html
The Jewish States of America
Red-Blue
State Politics
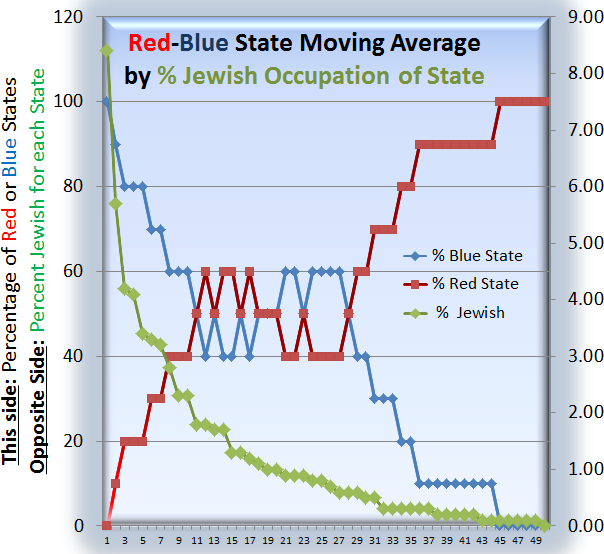
sorted by % Jewish Occupation of State
(% liberal or % conservative on the left axis)
(% Jewish on the right axis)
State Politics
sorted by % Jewish Occupation of State
(% liberal or % conservative on the left axis)
(% Jewish on the right axis)
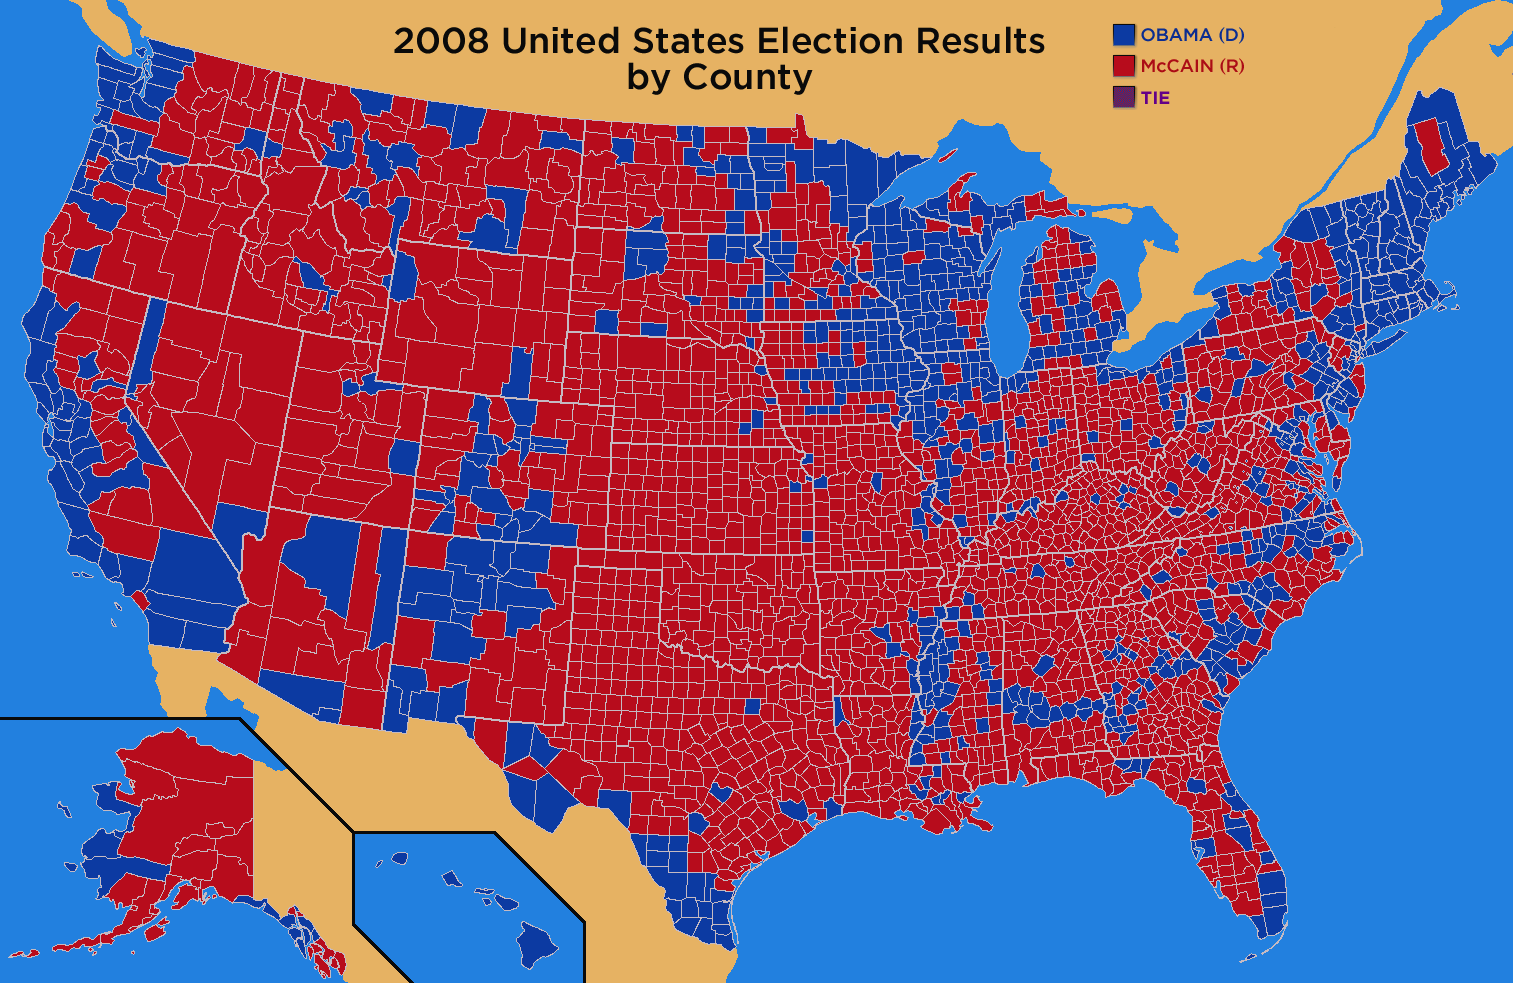
THEORY: If the Jewish occupation of your State exceeds 2%, as they are in 10 States, you are all but guaranteed to live in a Blue State.
(Caviot:
Florida being a swing State, half blue in the southern half of the
State where the Jews live, half red in the panhandle and central parts
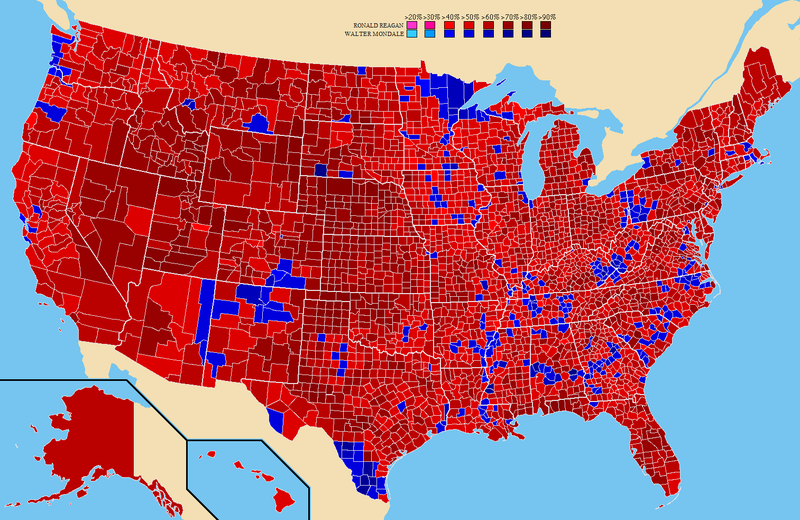
of the State where the Jews do not live, and then there is Nevada,
whose every county voted for Ronald Reagan in 1984, as seen in the
concurrent post Iowa's Drugged Mind )
THEORY: If your Jewish occupation of your State is less than 0.5%, as happens in 19 States, you are all but guaranteed to live in a Red State
(Caviot: Iowa being the lonely
exception in the 19 States having the fewest number of Jews residing
within it. We explain the special case of Iowa and why Iowa is a Blue State in special separate post this
month entitled Iowa's Drugged Mind)
As the Jewish population increases, so does the likelihood of you living in a Blue State.
In reverse, as the Jewish population decreases, so are you more likely to live in a Red State.
Note: The chart above
correlates well with the observation that Jewish population within a
State has a direct influence upon the political party affiliation of
that State.
- Note a steep drop in Blue States corresponds to a deep drop in Jewish occupied territory; while, a slow drop in Red States corresponds to a slow rise in Jewish occupied territory.
- Note that the national Judeo-MSM media plays a part
in influencing all States, imposing a nationwide leftist bias in each
State, even the Red States. (Especially in "first in the nation" Iowa)
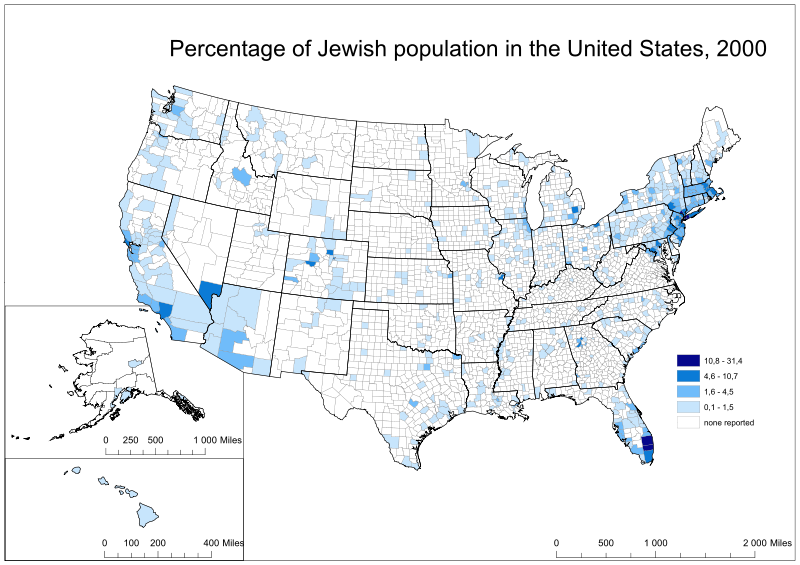
- The actual data used from the Jewish Virtual Library.
If you love freedom,
pick a State to live in
which does not have
a large number of Jews.
Freedom in Red
vs
Repression in Blue
From the chart above, (taken from: the George Mason University Mercatus Center study, And the least free state in America, is…), we can see a correlation between the percentage of Jews in a State versus the chances it will be a highly regulated and repressive State. Michael Bloomberg comes to mind as one reason why New York is the most repressive State in the United States.
Of course, the graph is heavily influenced by the percentage of other minorities as well; hence the reason it is weighted down by States like Louisiana and Mississippi.
The screenshot below of the George Mason University Mercatus Center study is below
Dark Blue - Most Regulated States
Yellow - Least Regulated States
Yellow - Least Regulated States
2008 Red Counties vs Blue Counties
Barack Obama vs John McCain
1984 Red Counties vs Blue Counties
Ronald Reagan vs Walter Mondale
Ronald Reagan vs Walter Mondale
Blue States colored as Blue
Red States colored as Red
Red States colored as Red
| Freedom | State | Jewish |
| 1 | North Dakota | 0.10% |
| 2 | South Dakota | 0.00% |
| 3 | Tennessee | 0.30% |
| 4 | New Hampshire | 0.80% |
| 5 | Oklahoma | 0.10% |
| 6 | Idaho | 0.10% |
| 7 | Missouri | 1.00% |
| 8 | Virginia | 1.20% |
| 9 | Georgia | 1.30% |
| 10 | Utah | 0.20% |
| 11 | Arizona | 1.70% |
| 12 | Montana | 0.10% |
| 13 | Alaska | 0.90% |
| 14 | Texas | 0.60% |
| 15 | South Carolina | 0.30% |
| 16 | Indiana | 0.30% |
| 17 | Delaware | 1.70% |
| 18 | Alabama | 0.20% |
| 19 | Colorado | 1.80% |
| 20 | Nevada | 2.80% |
| 21 | New Mexico | 0.60% |
| 22 | Nebraska | 0.30% |
| 23 | Florida | 3.40% |
| 24 | North Carolina | 0.30% |
| 25 | Iowa | 0.20% |
| 26 | Kansas | 0.60% |
| 27 | Kentucky | 0.30% |
| 28 | Oregon | 1.10% |
| 29 | Washington | 0.70% |
| 30 | Massachusetts | 4.20% |
| 31 | Pennsylvania | 2.30% |
| 32 | Arkansas | 0.10% |
| 33 | Ohio | 1.30% |
| 34 | Minnesota | 0.90% |
| 35 | Michigan | 0.80% |
| 36 | Wyoming | 0.20% |
| 37 | Louisiana | 0.20% |
| 38 | Wisconsin | 0.50% |
| 39 | Maine | 1.00% |
| 40 | Connecticut | 3.20% |
| 41 | Mississippi | 0.10% |
| 42 | West Virginia | 0.10% |
| 43 | Vermont | 0.90% |
| 44 | Maryland | 4.10% |
| 45 | Illinois | 2.30% |
| 46 | Rhode Island | 1.80% |
| 47 | Hawaii | 0.50% |
| 49 | New Jersey | 5.70% |
| 49 | California | 3.30% |
| 50 | New York | 8.40% |
SOURCE: The Jewish Virtual Library
And the least free state in America, is… by George Mason University Mercatus Center
| You can read further at | The Problem |
| You can read further at | Guide to "Checks and Balances" |
| You can read further at | The Solution |
| Write us at | letters@thechristiansolution.com |
Article located at:
http://www.thechristiansolution.com/doc2013/580_IowaPropaganda.html
Last Hope for America
Christian Libertarian: Harmonious Union
of
Church and State
Christian Libertarian: Harmonious Union
of
Church and State
Must Read Classics
Problem
"Checks and Balances"
Solution
Complete
Political
Spectrum
Holocaust
Fraud
Jewish
Final
Solution
Progressive
Tale
Chosen
People
History of the World
Part 1
Part 2
Part 3
Part 4
Part 5
Part 6
Jewish
Century
Great
Sanhedrin
Four
Diasporas
Four
Diasporas
Jewish
Apartheid
media-Scribe
FRAUD
The Christian Solution © First Release: March 15, 2008